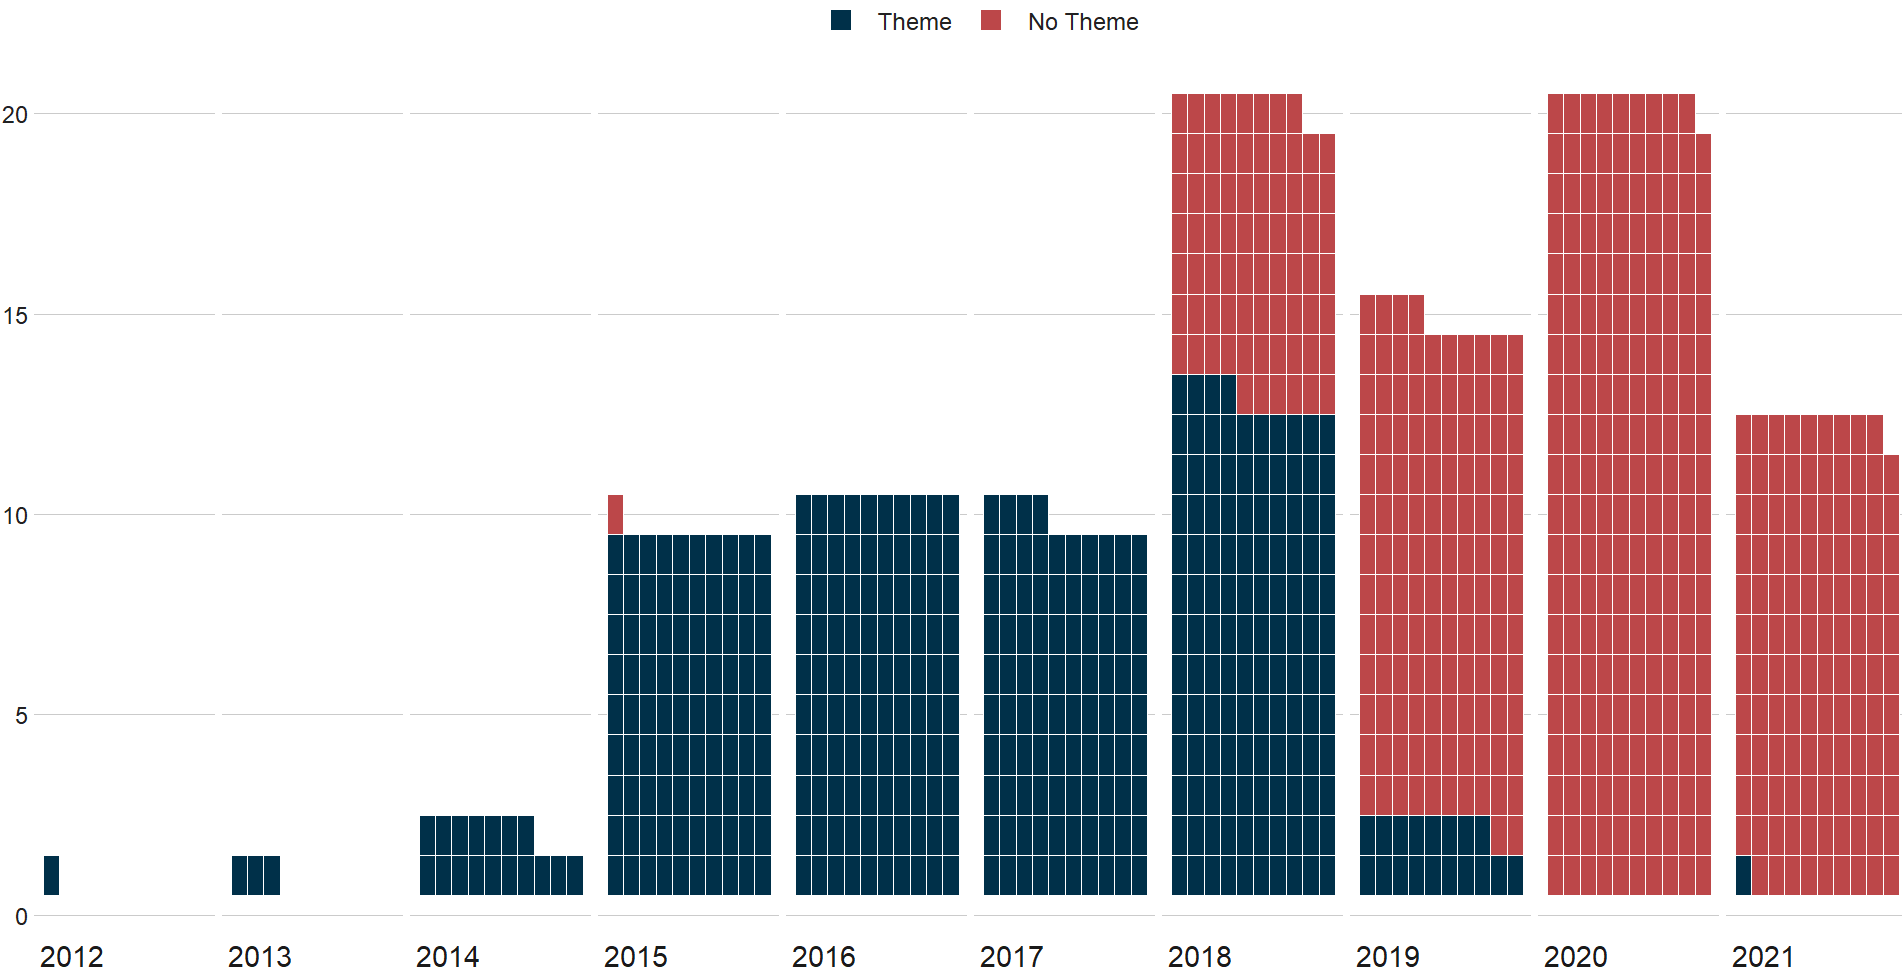
Packages we will need: In this blog, we will look at visualising proportions in a few lines. I have some aid data and I want to see what proportion of the aid does not have a theme category. This can be useful to visualise incomplete data across years or across categories. First, we can make … Continue reading How to graph proportions with the waffle and treemapify packages in R
Copy and paste this URL into your WordPress site to embed