
The Manifesto Project maintains a database of political party manifestos for around 50 countries. It covers free and democratic elections since 1945 in various countries.
To access the manifestos, we install and load the manifestoR package, which provides an API between R and The Manifesto Project site.
On the website, we can navigate the Manifesto Project database and search for any country for a given time period in the Data Dashboard section on the site. For example, I search for Ireland from 2012 until the present day and I can see the most recent manifestos put forward by the parties.
We can see the number code for each party. (We will need to use these when downloading the texts into R via the API).

Click here for the full CRAN PDF which gives more information for the manifestoR package.
So first, install the packages.
install.packages("manifestoR")
library(manifestoR)
But we cannot just access the data right away.
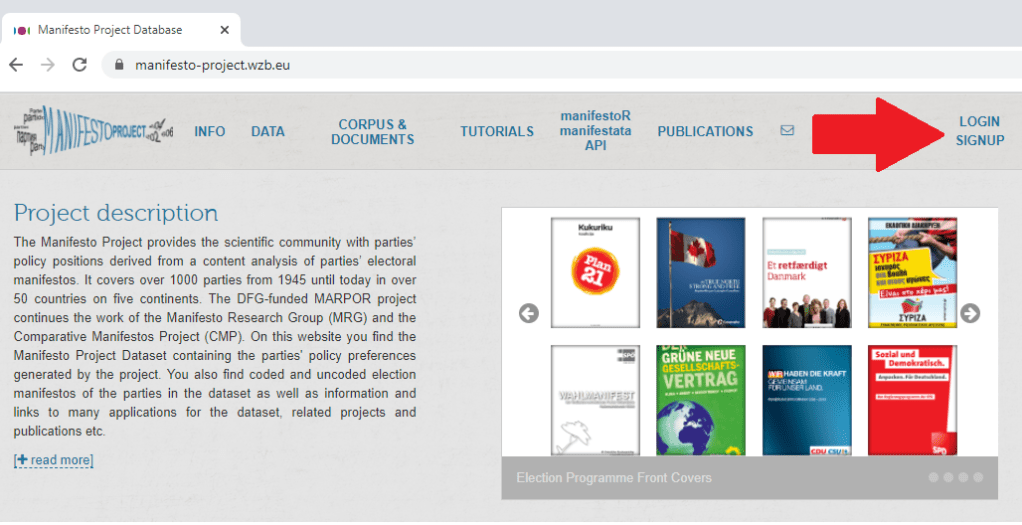
In order to download any manifesto text from the database, we need to first set up an account on the website and download an API key. So first step to do is go on the website and sign up.
Then you go to your website profile and click download API Key file (txt).

Then we go back on R and write in:
mp_key <- mp_setapikey(file.choose())Choose the txt file downloaded from the website … and hopefully you should be all set up to access all the manifesto text data.
Now, we can choose the manifestos we want to download.
Using the mp_corpus() function, we can choose the country and date that we want and download lists of all the texts.
manifestos_2016 <- mp_corpus(countryname == "Ireland" & edate > as.Date("2016-02-01"))Note that the date I enter into the mp_corpus() function corresponds with the date from the Manifesto Project website. If there is a way to look this up directly through R, please let me know!
If we look at the manifestos_2016 object we just downloaded:
View(manifestos_2016)
We see we have ten lists. Say, for example, the party I want to look at is Fine Gael, I need the party ID code assigned by the Manifesto Project.
Similar to how I got the date, I can look up the Data Dashboard to find the party code for Fine Gael. Or I can search for the ID via this site.
It was funny to see that all the names of the Irish parties are in English, which I never hear! Fine Gael is Irish for Tribes of Ireland and I guess Family is another way to translate that.
The ID code for the party is 53520, which is the seventh list. So index this list and create a new tibble structure for the manifesto text.
fg_2016 <- as_tibble(manifestos_2016[7])
View(fg_2016)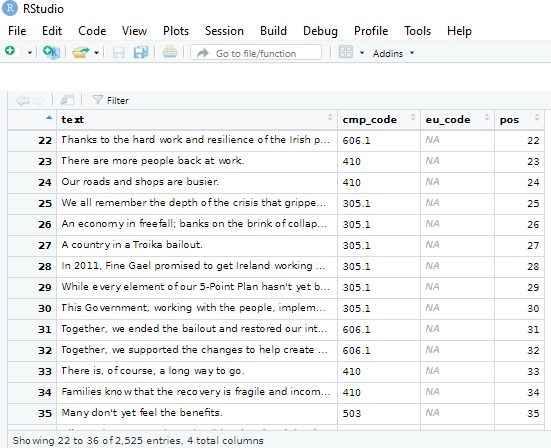
The cmp_code refers to the value that coders from the Manifesto Project have assigned to each topic or policy position that the party puts forward in their text.
For example 104 means that the party speaks positively of the military, whereas 105 means that the party speaks of the military in a negative way.
I don’t know what the eu_code is in reference to, but it is all blank in the 2016 coding…
In another post, I hope to write about text mining and sentiment analysis with manifestos. But I’ll leave that to another day.
An alternative way to download and store the manifestos is to download everything from the database:
all_manifestos <- mp_maindataset()
And I want to subset all Irish parties only:
ireland_manifestos <- all_manifestos[which(all_manifestos$countryname == "Ireland"),]With these all ready, there are some really interesting functions we can run with the data and the coding of the texts by the Manifesto Project.
For example, the rile() function. This calculates the Right Left Score.
Essentially, higher RILE scores indicate that the party leans more right on the ideological spectrum, with a maximum score of +100 if the whole manifesto is devoted to ‘right’ categories. Conversely, lower RILE scores indicate that the party leans more left (and a score of -100 would mean the entire manifesto puts forward exclusively ‘left’ categories)
Of course, it is a crude instrument to compress such a variety of social, political and economic positions onto a single dimension. But as long as we keep that caveat in mind, it is a handy shorthanded approach to categorising the different parties.
Additionally, Molder (2016) in his paper, “The validity of the RILE left–right index as a measure of party policy” argues that the index is not very valid. Additional researchers have also found that RILE index inaccurately places political parties in policy space as manifestos are not actual binding policies but rather directional signals and aspriations (see Pelizzo’s (2003) paper, “Party positions or party direction? An analysis of Party Manifesto Data” for more on this)
So take these figures with a grain of salt. But it is interesting to visualise the trends.
I continue subsetting until I have only the largest parties in Ireland and put them into big_parties object. The graph gets a bit hectic when including all the smaller parties in the country since 1949. Like in most other countries, party politics is rarely simple.
Next I can simply create a new rile_index variable and graph it across time.
big_parties$rile_index <- rile(big_parties)The large chuck in the geom_text() command is to only show the name of the party at the end of the line. Otherwise, the graph is far more busy and far more unreadable.
graph_rile <- big_parties %>%
group_by(partyname) %>%
ggplot(aes(x= as.Date(edate), y = rile_index, color=partyname)) +
geom_point() + geom_line() +
geom_text(data=. %>%
arrange(desc(edate)) %>%
group_by(partyname) %>%
slice(1),
aes(label=partyname), position=position_jitter(height=2), hjust = 0, size = 5, angle=40) +
ggtitle("Relative Left Right Ideological Position of Major Irish Parties 1949 - 2016") +
xlab("Year") + ylab("Right Left (RILE) Index")
While the graph is a bit on the small size, what jumps out immediately is that there has been a convergence of the main political parties toward the ideological centre. In fact, they are all nearing left of centre. The most right-wing a party has ever been in Ireland was Fine Gael in the 1950s, with a RILE score nearing 80. Given their history of its predecessor “Blueshirts” group, this checks out.
The Labour Party has consistently been very left wing, with its most left-leaning RILE score of -40 something in the early 1950s and again in early 1980s.
Ireland joined the European Union in 1978, granted free third level education for all its citizens since the 1990s and in genenral, has seen a consistent trend of secularisation in society, these factors all could account for the constricting lines converging in the graph for various socio-economic reasons.
In recent years Ireland has become more socially liberal (as exemplified by legalisation of abortion, legalisation of same sex marriage) so these lines do not surprise. Additionally, we do not have full control over monetary policy since joining the euro, so again, this mitigates the trends of extreme economic positions laid out in manifestos.
References
Mölder, M. (2016). The validity of the RILE left–right index as a measure of party policy. Party Politics, 22(1), 37-48.
Pelizzo, R. (2003). Party positions or party direction? An analysis of party manifesto data. West European Politics, 26(2), 67-89.
