Packages we will need:
library(tidyverse)
library(forcats)
library(tidytext)
library(ggthemes)
library(democracyData)
library(magrittr)
For this blog, we are going to look at the titles of all countries’ heads of state, such as Kings, Presidents, Emirs, Chairman … understandably, there are many many many ways to title the leader of a country.
First, we will download the PACL dataset from the democracyData package.
Click here to read more about this super handy package:
If you want to read more about the variables in this dataset, click the link below to download the codebook by Cheibub et al.
pacl <- redownload_pacl()We are going to look at the npost variable; this captures the political title of the nominal head of stage. This can be King, President, Sultan et cetera!
pacl %>%
  count(npost) %>%
  arrange(desc(n))
If we count the occurence of each title, we can see there are many ways to be called the head of a country!
"president"                         3693
"prime minister"                    2914
"king"                               470
"Chairman of Council of Ministers"   229
"premier"                            169
"chancellor"                         123
"emir"                               117
"chair of Council of Ministers"      111
"head of state"                       90
"sultan"                              67
"chief of government"                 63
"president of the confederation"      63
""                                    44
"chairman of Council of Ministers"    44
"shah"                                33

# ... with 145 more rows
155 groups is a bit difficult to meaningfully compare.
So we can collapse some of the groups together and lump all the titles that occur relatively seldomly – sometimes only once or twice – into an “other” category.

First, we use grepl() function to take the word president and chair (chairman, chairwoman, chairperson et cetera) and add them into broader categories.
Also, we use the tolower() function to make all lower case words and there is no confusion over the random capitalisation.
 pacl %<>%
  mutate(npost = tolower(npost)) %>%
  mutate(npost = ifelse(grepl("president", npost), "president", npost)) %>%
  mutate(npost = ifelse(grepl("chair", npost), "chairperson", npost))
Next, we create an "other leader type" with the fct_lump_prop() function.
We specifiy a threshold and if the group appears fewer times in the dataset than this level we set, it is added into the “other” group.
pacl %<>%
  mutate(regime_prop = fct_lump_prop(npost,
                                   prop = 0.005,
                                   other_level = "Other leader type")) %>%
  mutate(regime_prop = str_to_title(regime_prop))
Now, instead of 155 types of leader titles, we have 10 types and the rest are all bundled into the Other Leader Type category
President            4370
Prime Minister       2945
Chairperson           520
King                  470
Other Leader Type     225
Premier               169
Chancellor            123
Emir                  117
Head Of State          90
Sultan                 67
Chief Of Government    63

The forcast package has three other ways to lump the variables together.
First, we can quickly look at fct_lump_min().
We can set the min argument to 100 and look at how it condenses the groups together:
pacl %>%
  mutate(npost = tolower(npost)) %>%

  mutate(post_min = fct_lump_min(npost,
                                   min = 100,
                                   other_level = "Other type")) %>%
  mutate(post_min = str_to_title(post_min)) %>%
  count(post_min) %>%
  arrange(desc(n))
President       4370
Prime Minister  2945
Chairperson      520
King             470
Other Type       445
Premier          169
Chancellor       123
Emir             117
We can see that if the post appears fewer than 100 times, it is now in the Other Type category. In the previous example, Head Of State only appeared 90 times so it didn’t make it.
Next we look at fct_lump_lowfreq().
This function lumps together the least frequent levels. This one makes sure that “other” category remains as the smallest group. We don’t add another numeric argument.
pacl %>%
  mutate(npost = tolower(npost)) %>%
  mutate(post_lowfreq  = fct_lump_lowfreq(npost,
                                   other_level = "Other type")) %>%
  mutate(post_lowfreq = str_to_title(post_lowfreq)) %>%
  count(post_lowfreq) %>%
  arrange(desc(n))
President       4370
Prime Minister  2945
Other Type      1844
This one only has three categories and all but president and prime minister are chucked into the Other type category.
Last, we can look at the fct_lump_n() to make sure we have a certain number of groups. We add n = 5 and we create five groups and the rest go to the Other type category.
pacl %>%
  mutate(npost = tolower(npost)) %>%
  mutate(post_n  = fct_lump_n(npost,
                                n = 5,
                                other_level = "Other type")) %>%
  mutate(post_n = str_to_title(post_n)) %>%
  count(post_n) %>%
  arrange(desc(n))
President       4370
Prime Minister  2945
Other Type       685
Chairperson      520
King             470
Premier          169

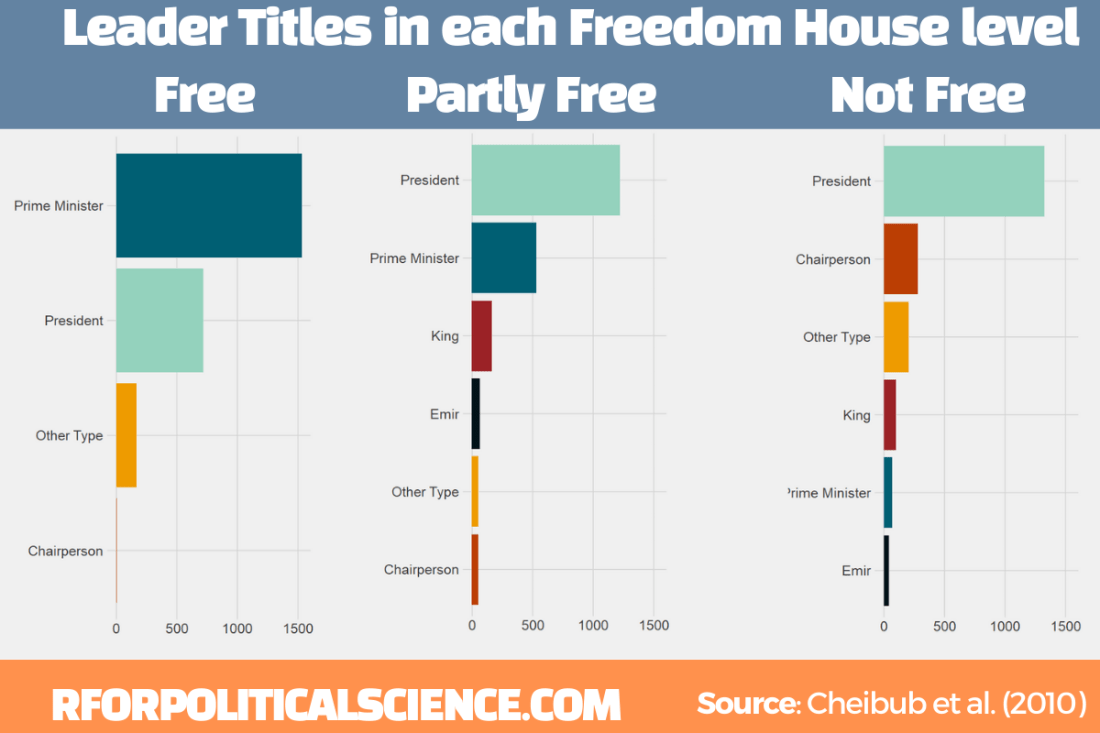
Next we can make a simple graph counting the different leader titles in free, partly free and not free Freedom House countries. We will use the download_fh() from DemocracyData package again
fh <- download_fh()We will use the reorder_within() function from tidytext package.
Click here to read the full blog post explaining the function from Julia Silge’s blog.
First we add Freedom House data with the inner_join() function
Then we use the fct_lump_n() and choose the top five categories (plus the Other Type category we make)
pacl %<>%
  inner_join(fh, by = c("cown", "year")) %>%
  mutate(npost  = fct_lump_n(npost,
                  n = 5,
                  other_level = "Other type")) %>%
  mutate(npost = str_to_title(npost))
Then we group_by the three Freedom House status levels and count the number of each title:
pacl %<>%
  group_by(status) %>%
  count(npost) %>%
  ungroup() %>%
Using reorder_within(), we order the titles from most to fewest occurences WITHIN each status group:
pacl %<>%
  mutate(npost = reorder_within(npost, n, status))
To plot the columns, we use geom_col() and separate them into each Freedom House group, using facet_wrap(). We add scales = "free y" so that we don’t add every title to each group. Without this we would have empty spaces in the Free group for Emir and King. So this step removes a lot of clutter.
pacl_colplot <- pacl %>%
  ggplot(aes(fct_reorder(npost, n), n)) +
  geom_col(aes(fill = npost), show.legend = FALSE) +
  facet_wrap(~status, scales = "free_y")
Last, I manually added the colors to each group (which now have longer names to reorder them) so that they are consistent across each group. I am sure there is an easier and less messy way to do this but sometimes finding the easier way takes more effort!
We add the scale_x_reordered() function to clean up the names and remove everything from the underscore in the title label.
pacl_colplot + scale_fill_manual(values = c("Prime Minister___F" = "#005f73",
                                "Prime Minister___NF" = "#005f73",
                                "Prime Minister___PF" = "#005f73",

                               "President___F" = "#94d2bd",
                               "President___NF" = "#94d2bd",
                               "President___PF" = "#94d2bd",

                               "Other Type___F" = "#ee9b00",
                               "Other Type___NF" = "#ee9b00",
                               "Other Type___PF" = "#ee9b00",

                               "Chairperson___F" = "#bb3e03",
                               "Chairperson___NF" = "#bb3e03",
                               "Chairperson___PF" = "#bb3e03",

                               "King___F" = "#9b2226",
                               "King___NF" = "#9b2226",
                               "King___PF" = "#9b2226",

                               "Emir___F" = "#001219",
                               "Emir___NF" = "#001219",
                               "Emir___PF" = "#001219")) +
  scale_x_reordered() +
  coord_flip() +
  ggthemes::theme_fivethirtyeight() +
  themes(text = element_size(size = 30))
In case you were curious about the free country that had a chairperson, Nigeria had one for two years.
pacl %>%
  filter(status == "F") %>%
  filter(npost == "Chairperson") %>%
  select(Country = pacl_country) %>%
  knitr::kable("latex") %>%
  kableExtra::kable_classic(font_size = 30)
References
Cheibub, J. A., Gandhi, J., & Vreeland, J. R. (2010). Democracy and dictatorship revisited. Public choice, 143(1), 67-101.
