Packages we will need:
install.packages("easystats", repos = "https://easystats.r-universe.dev")
library(easystats)
easystats::install_suggested()
Easystats is a collection of R packages, which aims to provide a framework to tame the scary R statistics and their pesky models, according to their github repo.
Click here to browse the github and here to go to the specific perfomance package CRAN PDF
First run your regression. I will try to explain variance is Civil Society Organization participation (CSOs) with the independent variables in my model with Varieties of Democracy data in 1990.
cso_model <- lm(cso_part ~ education_level + mortality_rate + democracy,data = vdem_90)| Dependent variable: | |
| cso_part | |
| education_level | -0.017** |
| (0.007) | |
| mortality_rate | -0.00001 |
| (0.00004) | |
| democracy | 0.913*** |
| (0.064) | |
| Constant | 0.288*** |
| (0.054) | |
| Observations | 134 |
| R2 | 0.690 |
| Adjusted R2 | 0.682 |
| Residual Std. Error | 0.154 (df = 130) |
| F Statistic | 96.243*** (df = 3; 130) |
| Note: | *p<0.1; **p<0.05; ***p<0.01 |

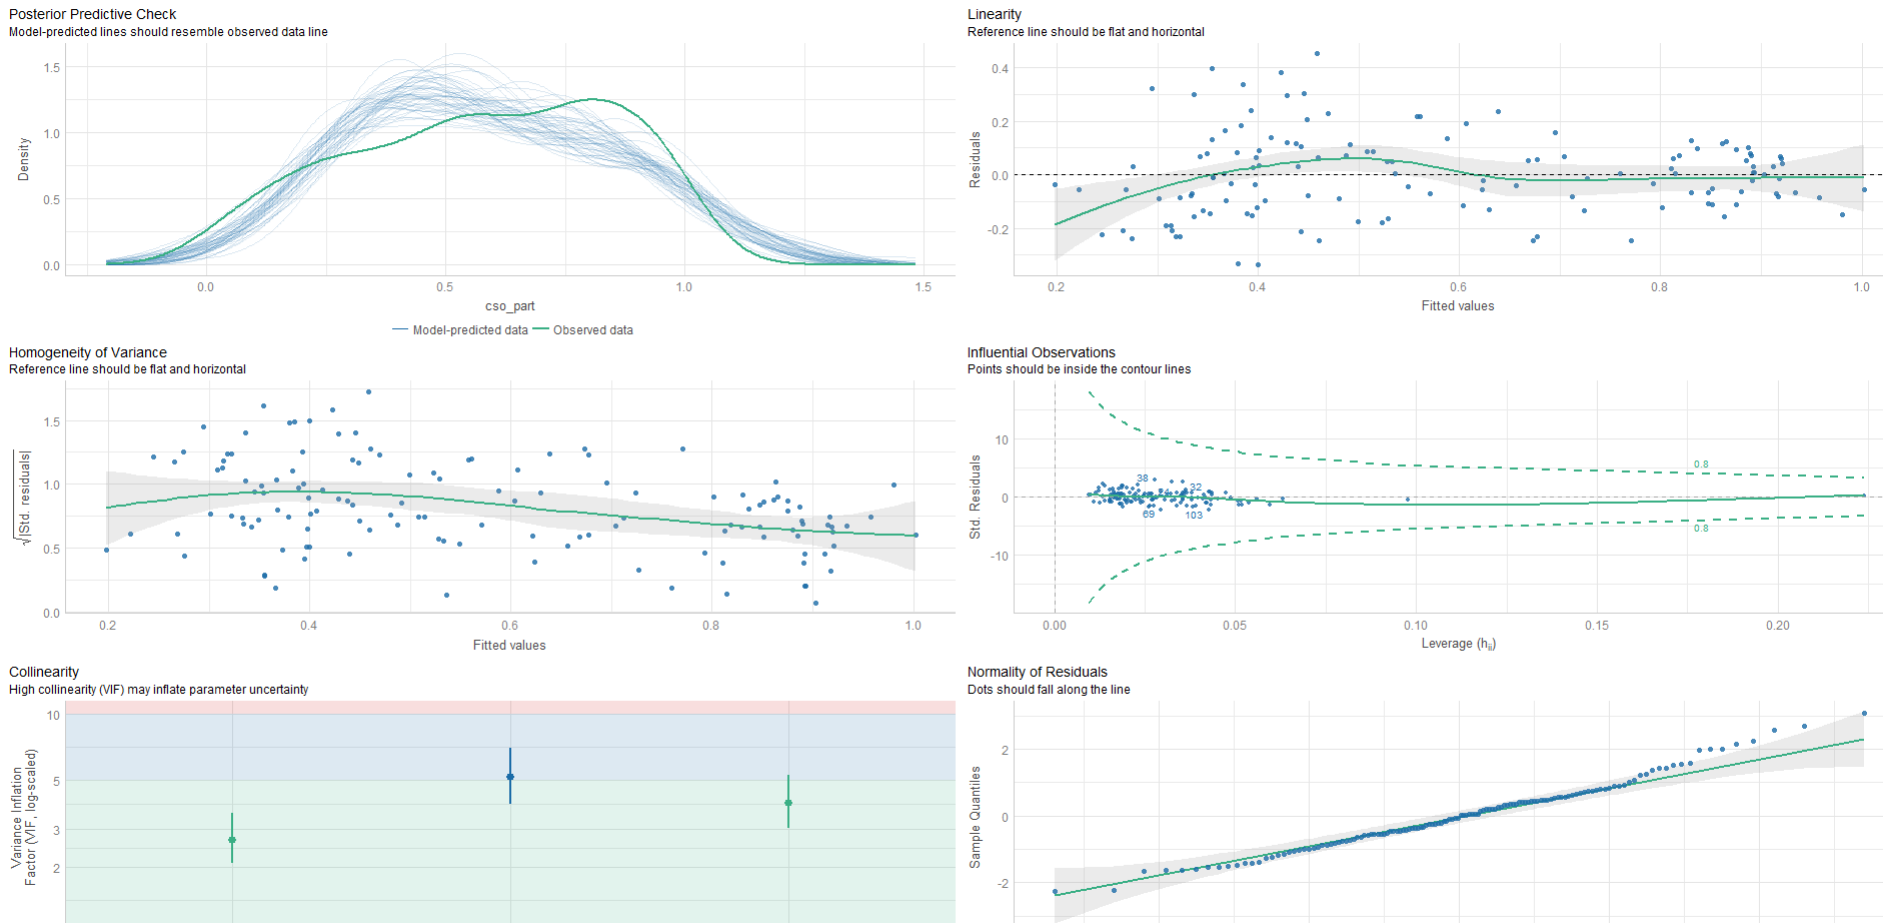
Then we check the assumptions:
performance::check_model(cso_model)


