Packages we will need:
library(unvotes)
library(lubridate)
library(tidyverse)
library(magrittr)
library(bbplot)
library(waffle)
How to download UN votes to R.
This package was created by David Robinson. Click here to read the CRAN PDF.

We will download both the votes roll calls and the issues. Then we can use the inner_join() variable to add them together by the ID.
un_votes <- unvotes::un_roll_calls

un_votes_issues <- unvotes::un_roll_call_issues

un_votes %<>%
  inner_join(un_votes_issues, by = "rcid")
We can create a year variable with the format() function and extract the year with “%Y”
un_votes %<>%
  mutate(year = format(date, format = "%Y"))
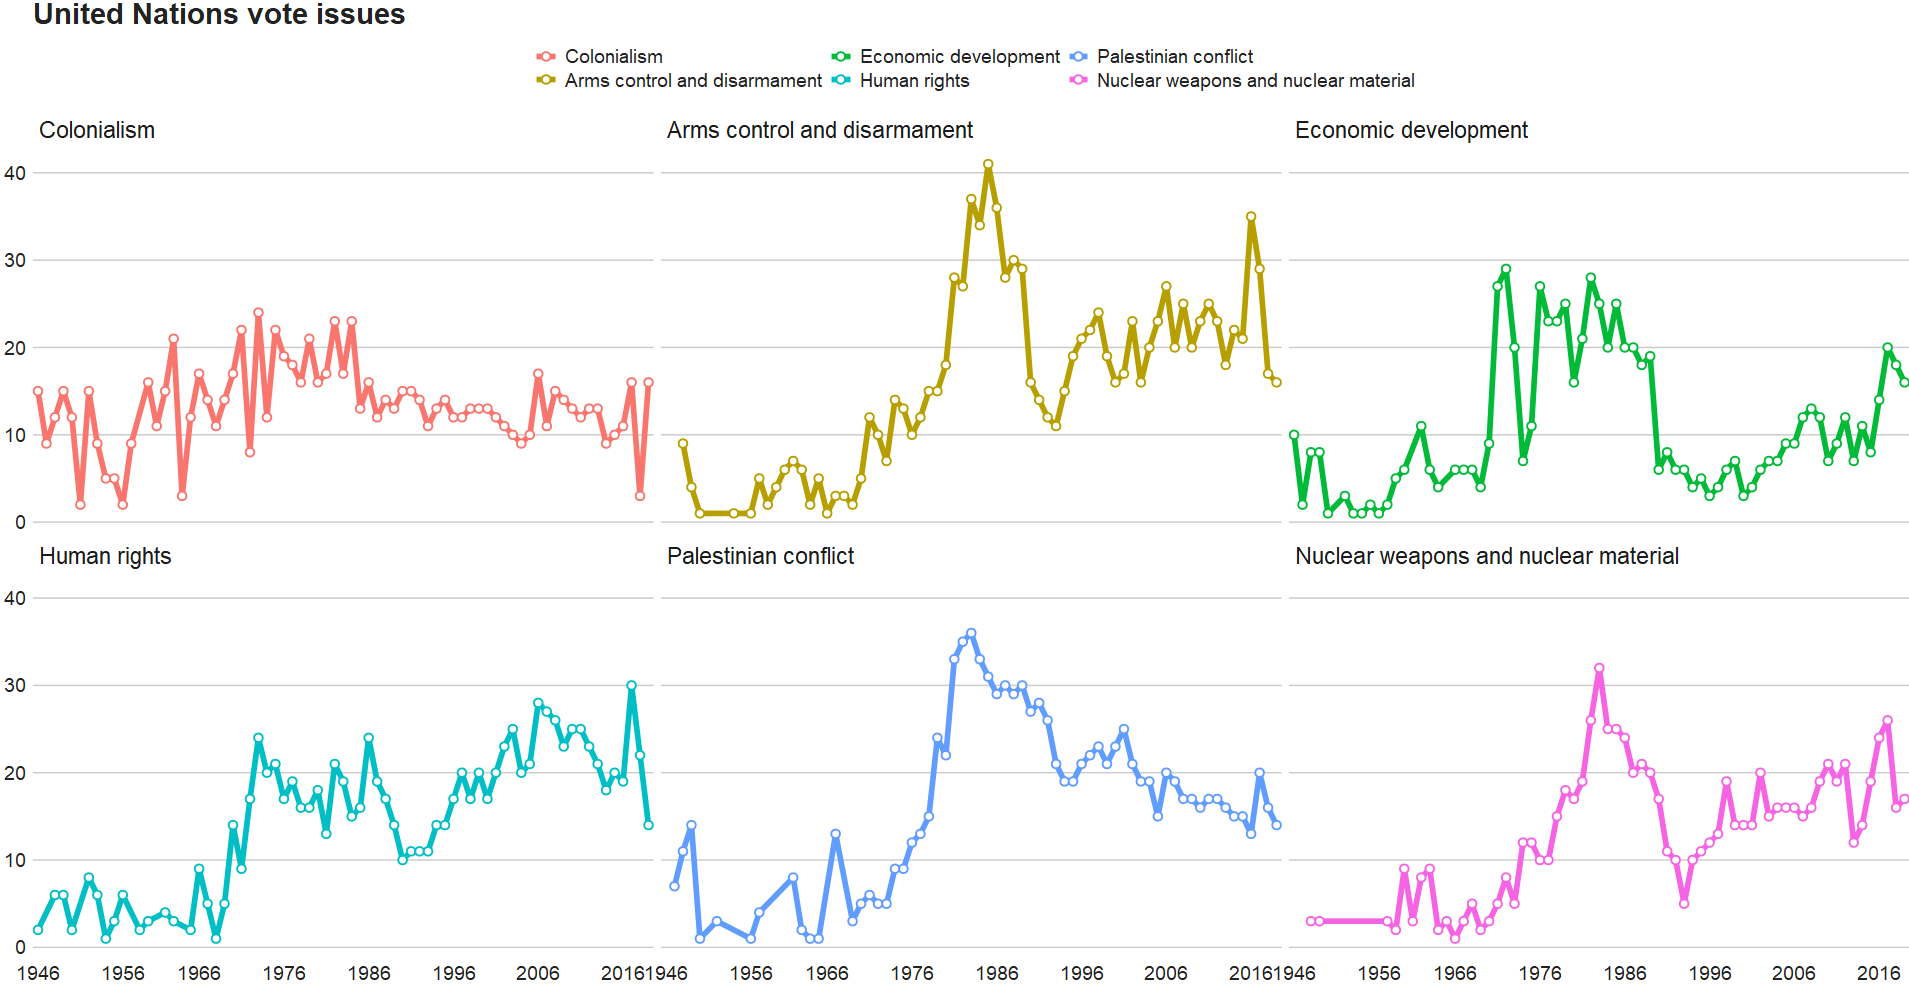
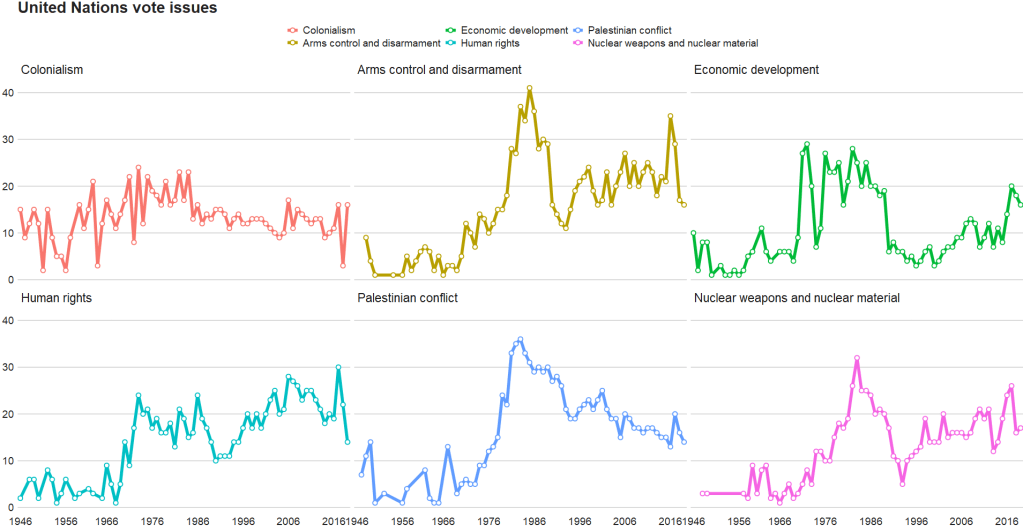
And graph out the count of each type of UN vote issue
un_votes %>%
  group_by(year) %>%
  count(issue) %>%
  ggplot(aes(x = year, y = n, group = issue, color = issue)) +
  geom_line(size = 2) +
  geom_point(aes(color = issue), fill = "white",
             shape = 21, size = 2, stroke = 1) +
  scale_x_discrete(breaks = round(seq(min(un_votes$year), max(un_votes$year), by = 10),1)) +
  bbplot::bbc_style() + facet_wrap(~issue)


Next we can look at which decade had the most votes across the issues with the waffle package
Click here to read more about the waffle package
un_votes %>%
  mutate(decade = substr(year, 1, 3)) %>%
  mutate(decade = paste0(decade, "0s")) %>%

  group_by(decade) %>%
  count(issue) %>%

  ggplot(aes(fill = issue, values = n)) +
  geom_waffle(color = "white",
              size = 0.3,
              n_rows = 10,
              flip = TRUE) +
  facet_wrap(~decade, nrow = 1, strip.position = "bottom") +
  bbplot::bbc_style()  +
scale_x_discrete(breaks = round(seq(0, 1, by = 0.2),3)) 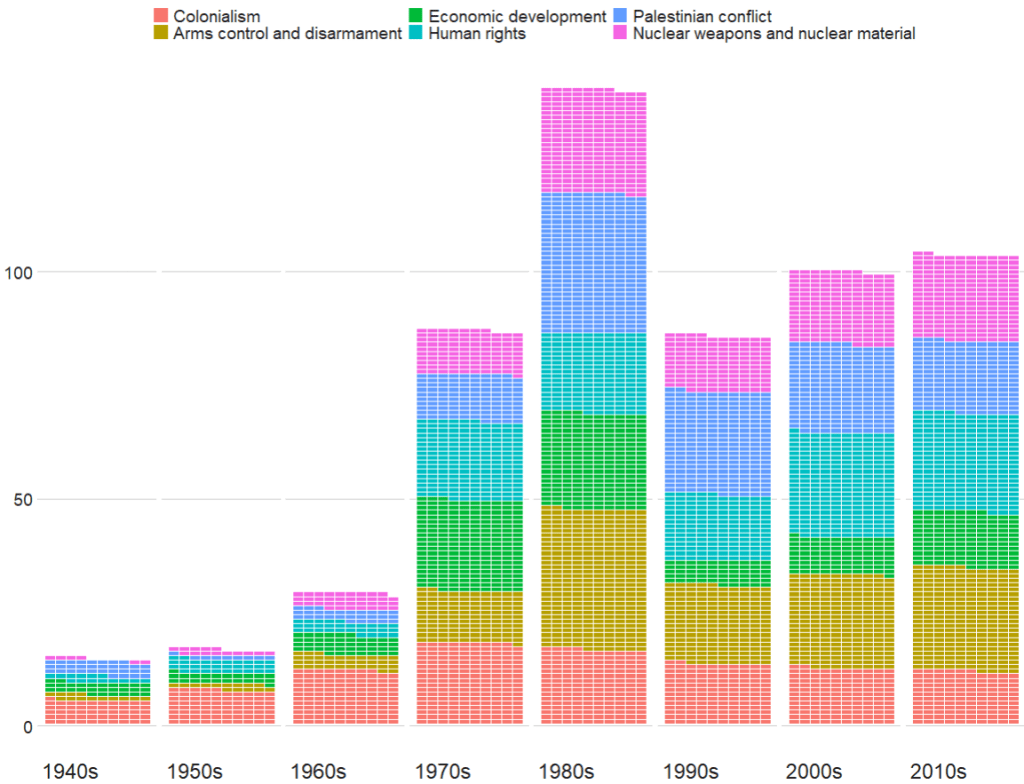
The 1980s were a prolific time for the UNGA with voting, with arms control being the largest share of votes. And it has stablised in the decades since.

Next we can look at votes in total
un_votes %>%
  mutate(issue = case_when(issue == "Nuclear weapons and nuclear material" ~ "Nukes",
                           issue == "Arms control and disarmament" ~ "Arms",
                           issue == "Palestinian conflict" ~ "Palestine",
                           TRUE ~ as.character(issue))) %>%
  count(issue) %>%
  ggplot(aes(x = reorder(issue, n), y = n, fill = as.factor(issue))) +
  geom_bar(stat = "identity") +
  coord_polar("x", start = 0, direction = -1)  +
  ggthemes::theme_pander()  +
  bbplot::bbc_style() +
    theme(axis.text = element_blank(),
          axis.title.x = element_blank(),
          axis.title.y = element_blank(),
          axis.ticks = element_blank(),
          text = element_text(size = 25),
          panel.grid = element_blank()) +
    ggtitle(label = "UN Votes by issue ",
            subtitle = "Source: unvotes package")
