We can all agree that Wikipedia is often our go-to site when we want to get information quick. When we’re doing IR or Poli Sci reesarch, Wikipedia will most likely have the most up-to-date data compared to other databases on the web that can quickly become out of date.

So in R, we can scrape a table from Wikipedia and turn into a database with the rvest package .
First, we copy and paste the Wikipedia page we want to scrape into the read_html() function as a string:
nato_members <- read_html("https://en.wikipedia.org/wiki/Member_states_of_NATO")Next we save all the tables on the Wikipedia page as a list. Turn the header = TRUE.
nato_tables <- nato_members %>% html_table(header = TRUE, fill = TRUE)The table that I want is the third table on the page, so use [[two brackets]] to access the third list.
nato_exp <- nato_tables[[3]]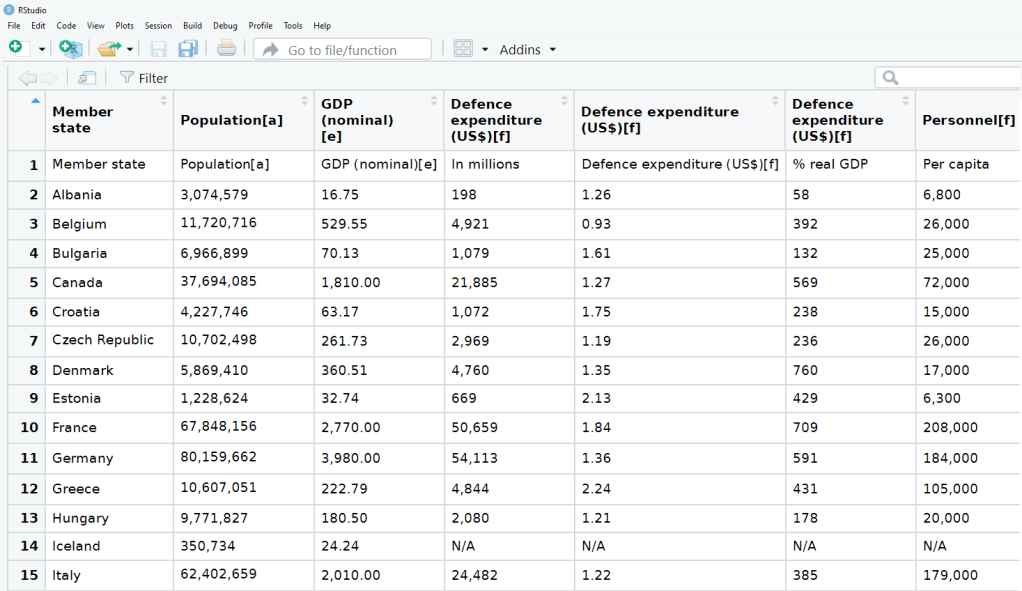
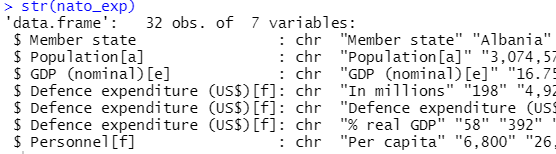
The dataset is not perfect, but it is handy to have access to data this up-to-date. It comes from the most recent NATO report, published in 2019.
Some problems we will have to fix.
- The first row is a messy replication of the header / more information across two cells in Wikipedia.
- The headers are long and convoluted.
- There are a few values in as N/A in the dataset, which R thinks is a string.
- All the numbers have commas, so R thinks all the numeric values are all strings.
There are a few NA values that I would not want to impute because they are probably zero. Iceland has no armed forces and manages only a small coast guard. North Macedonia joined NATO in March 2020, so it doesn’t have all the data completely.
So first, let’s do some quick data cleaning:
Clean the variable names to remove symbols and adds underscores with a function from the janitor package
library(janitor)
nato_exp  <- nato_exp %>% clean_names()
Delete the first row. which contains some extra header text:
nato_exp <- nato_exp[-c(1),]Rename the headers to better reflect the original Wikipedia table headings In this rename() function,
- the first string in the variable name we want and
- the second string is the original heading as it was cleaned from the above
clean_names()function:
nato_exp <- nato_exp %>%
 rename("def_exp_millions" = "defence_expenditure_us_f",
 "def_exp_gdp" = "defence_expenditure_us_f_2",
 "def_exp_per_capita" = "defence_expenditure_us_f_3",
 "population" = "population_a",
 "gdp" = "gdp_nominal_e",
 "personnel" = "personnel_f")
Next turn all the N/A value strings to NULL. The na_strings object we create can be used with other instances of pesky missing data varieties, other than just N/A string.
na_strings <- c("N A", "N / A", "N/A", "N/ A", "Not Available", "Not available")

nato_exp <- nato_exp %>% replace_with_na_all(condition = ~.x %in% na_strings)
Remove all the commas from the number columns and convert the character strings to numeric values with a quick function we apply to all numeric columns in the data.frame.
remove_comma <- function(x) {as.numeric(gsub(",", "", x, fixed = TRUE))}

nato_exp[2:7] <- sapply(nato_exp[2:7], remove_comma) 

Next, we can calculate the average NATO score of all the countries (excluding the member_state variable, which is a character string).
We’ll exclude the NATO total column (as it is not a member_state but an aggregate of them all) and the data about Iceland and North Macedonia, which have missing values.
nato_average <- nato_exp %>%
filter(member_state != 'NATO' & member_state != 'Iceland' & member_state != 'North Macedonia') %>%
summarise_if(is.numeric, mean, na.rm = TRUE)
Re-arrange the columns so the two data.frames match:
nato_average$member_state = "NATO average"
nato_average <- nato_average %>% select(member_state, everything())
Bind the two data.frames together
nato_exp <- rbind(nato_exp, nato_average)Create a new factor variable that categorises countries into either above or below the NATO average defense spending.
Also we can specify a category to distinguish those countries that have reached the NATO target of their defense spending equal to 2% of their GDP.
nato_exp <- nato_exp %>%
filter(member_state != 'NATO' & member_state!= "North Macedonia" & member_state!= "Iceland") %>%
dplyr::mutate(difference = case_when(def_exp_gdp >= 2 ~ "Above NATO 2% GDP quota", between(def_exp_gdp, 1.6143, 2) ~ "Above NATO average", between(def_exp_gdp, 1.61427, 1.61429) ~ "NATO average", def_exp_gdp <= 1.613 ~ "Below NATO average"))
Create a vector of hex colours to correspond to the different categories. I choose traffic light colors to indicate the
- green countries (those who have reached the NATO 2% quota),
- orange countries (above the NATO average but below the spending target) and
- red countries (below the NATO spending average).
The blue colour is for the NATO average bar,
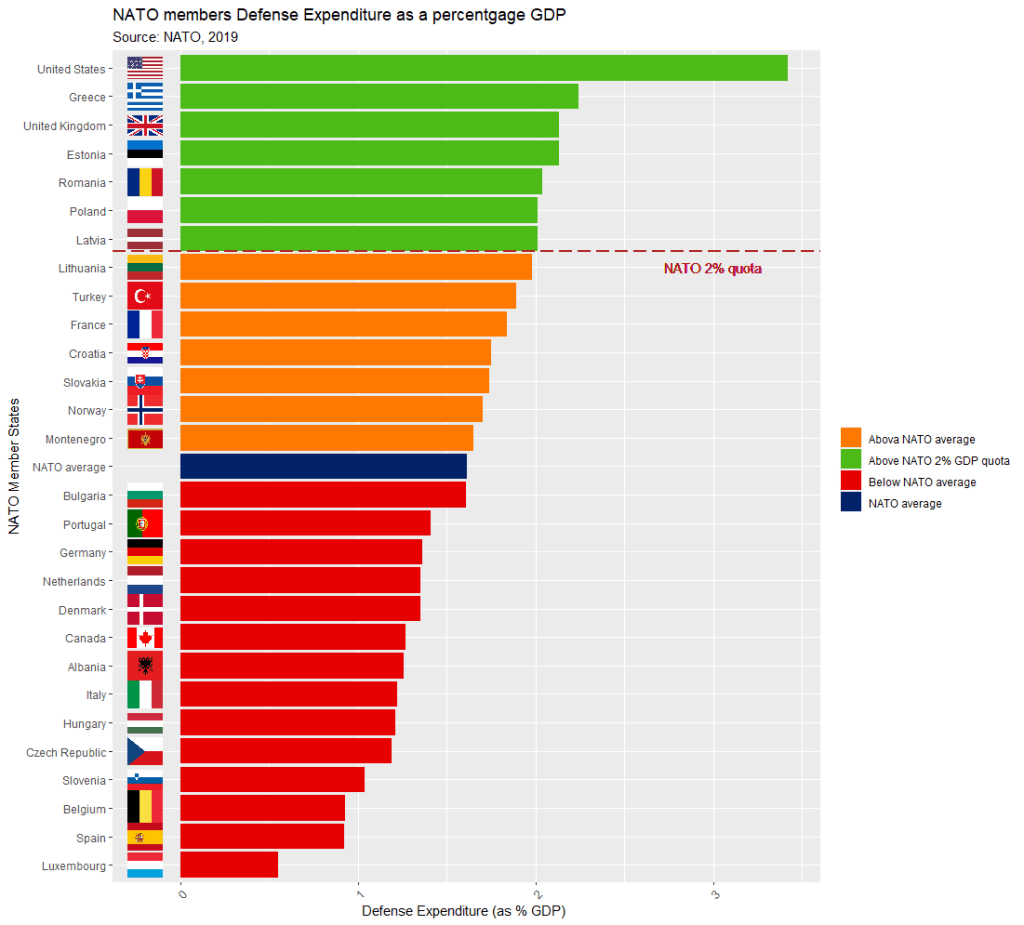
my_palette <- c( "Below NATO average" = "#E60000", "NATO average" = "#012169", "Above NATO average" = "#FF7800", "Above NATO 2% GDP quota" = "#4CBB17")Finally, we create a graph with ggplot, and use the reorder() function to arrange the bars in ascending order.
NATO allies are encouraged to hit the target of 2% of gross domestic product. So, we add a geom_vline() to demarcate the NATO 2% quota.
nato_bar <- nato_exp %>%
  filter(member_state != 'NATO' & member_state!= "North Macedonia" & member_state!= "Iceland") %>%
  ggplot(aes(x= reorder(member_state, def_exp_gdp), y = def_exp_gdp,
fill=factor(difference))) +
  geom_bar(stat = "identity") +
  geom_vline(xintercept = 22.55, colour="firebrick", linetype = "longdash", size = 1) +
  geom_text(aes(x=22, label="NATO 2% quota", y=3), colour="firebrick", text=element_text(size=20)) +
  labs(title = "NATO members Defense Expenditure as a percentage GDP ",
       subtitle = "Source: NATO, 2019",
       x = "NATO Member States",
       y = "Defense Expenditure (as % GDP) ")
Click here to read about adding flags to graphs with the ggimage package.
library(countrycode)
library(ggimage)

nato_exp$iso2 <- countrycode(nato_exp$member_state, "country.name", "iso2c")
Finally, we can print out the nato_bar graph!
nato_bar +
geom_flag(y = -0.2, aes(image = nato_exp$iso2)) +
coord_flip() +
expand_limits(y = -0.2) +
theme(legend.title = element_blank(), axis.text.x=element_text(angle=45, hjust=1)) + scale_fill_manual(values = my_palette)