Click here to download the Irish leader datatset. This file details information on all Taoisigh since 1922.
Source: Wikipedia

Tentative Codebook
| Variable Name | Variable Description |
| no | Taoiseach number |
| name | Name |
| party | Political party |
| constituency | Electoral constituency |
| born | Date of birth |
| died | Date of death |
| first_elected | Date first entered the Dail |
| entered_office | Date entering office of Taoiseach |
| left_office | Date leaving office of Taoiseach |
| left_dail | Date left the Dail |
| cum_days | Total number of days in Dail |
| cum_years | Total number of years in Dail |
| second_level | Secondary school Taoiseach attended |
| third_level | University Taoiseach attended |
| period | Number of times the person was Taoiseach |
| before_after_taoiseach | Title of cabinet positions held by the Taoiseach when he was not holding office of Taoiseach |
| while_taoiseach | Title of cabinet positions held by the Taoiseach when he was in office as Taoiseach |
| no_pos_before_after | Number of cabinet positions the man held when he was not holding office of Taoiseach |
| no_pos_dur | Number of cabinet positions the man held when he was Taoiseach |
| county_born | The county the Taoiseach was born in |
| age | Age of Taoiseach |
| age_enter | Age the man entered office of Taoiseach |
| gender | Gender |
Packages we will need:
library(tidyverse)
library(ggthemes)
library(readr)
library(sf)
library(tmap)
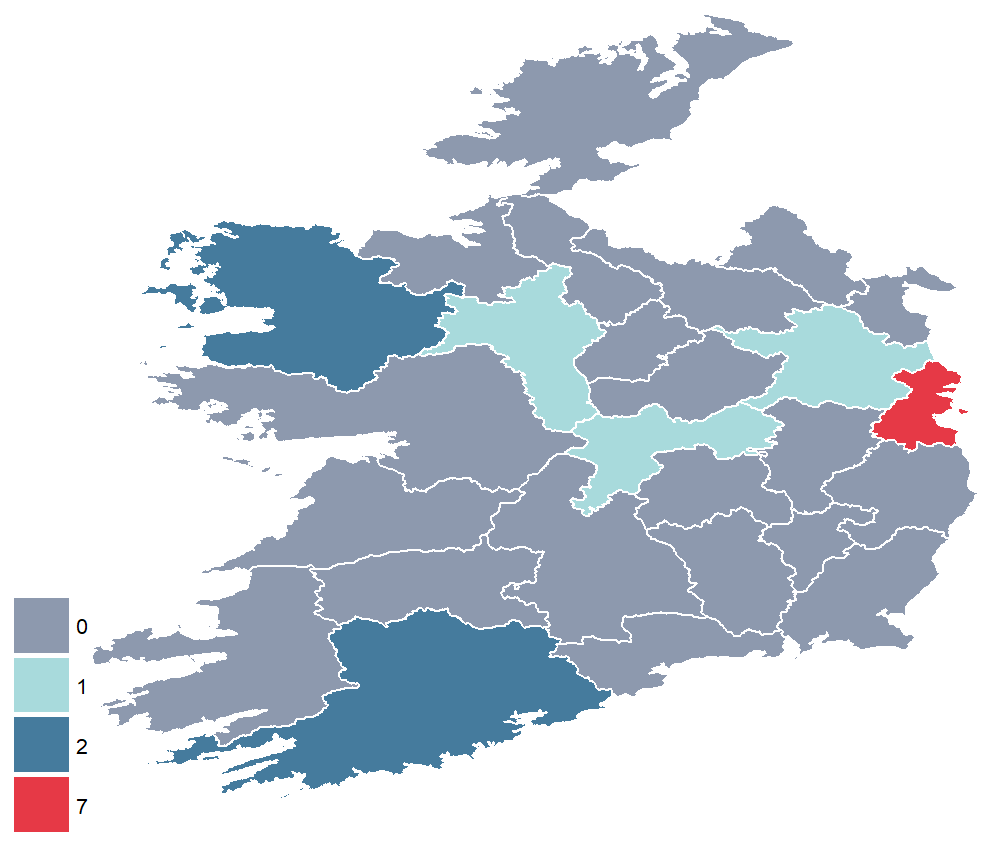
With the dataset, we can add map data and plot the 26 counties of Ireland.
If you follow this link below, you can download county map data from the following website by Chris Brundson
https://rpubs.com/chrisbrunsdon/part1
Thank you to Chris for the tutorial and data access!
Read in the simple features data with the st_read() from the sf package.
setwd("C:/Users/my_name/Desktop")

county_geom <- sf::st_read("counties.json") %>%
   clean_names() %>%
   mutate(county = stringr::str_to_title(county))
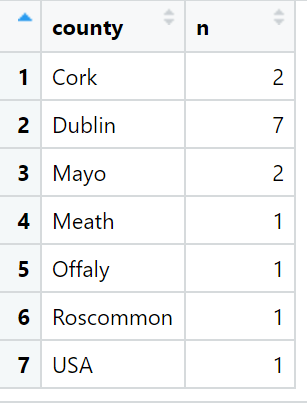
Next we count the number of counties that have given Ireland a Taoiseach with the group_by() and count() functions.
One Taoiseach, Eamon DeValera, was born in New York City, so he will not be counted in the graph.
Sorry Dev.

We can join the Taoisech dataset to the county_geom dataframe by the county variable. The geometric data has the counties in capital letters, so we convert tolower() letters.
Add the geometry variable in the main ggplot() function.
We can play around with the themes arguments and add the theme_map() from the ggthemes package to get the look you want.
I added a few hex colors to indicate the different number of countries.
If you want a transparent background, we save it with the ggsave() function and set the bg argument to “transparent”
full_taois %>%
  select(county = county_born, everything()) %>%
  distinct(name, .keep_all = TRUE) %>%
  group_by(county) %>%
  count() %>%
  ungroup() %>%
  right_join(county_geom, by = c("county" = "county")) %>%
  replace(is.na(.), 0) %>%
  ggplot(aes(geometry = geometry, fill = factor(n))) +
  geom_sf(linewidth = 1, color = "white") +
  ggthemes::theme_map() +
  theme(panel.background = element_rect(fill = 'transparent'),
    legend.title = element_blank(),
    legend.text = element_text(size = 20) )  +
scale_fill_manual(values = c("#8d99ae", "#a8dadc", "#457b9d", "#e63946", "#1d3557"))

ggsave('county_map.png', county_map, bg = 'transparent')
Counties that have given us Taoisigh
Source: Wikipedia
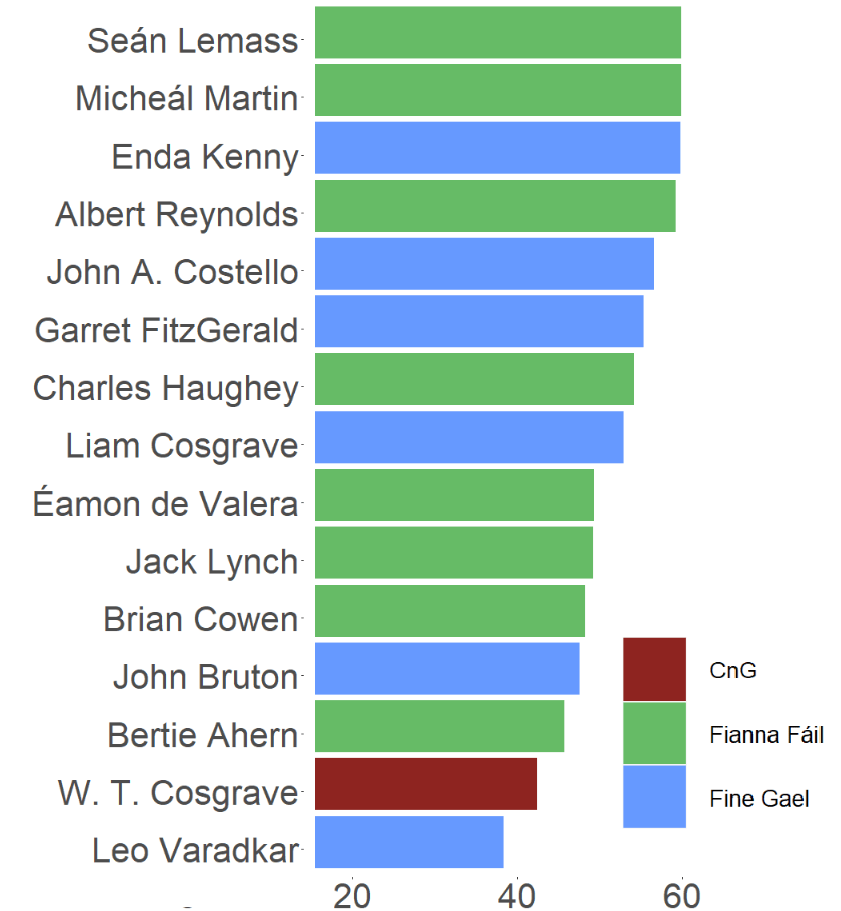
Next we can graph the ages of the Taoiseach when they first entered office. With the reorder() function, we can compare how old they were.
full_taois %>%
  mutate(party = case_when(party == "Cumann na nGaedheal" ~ "CnG",
                           TRUE ~ as.character(party))) %>%
  distinct(name, .keep_all = TRUE) %>%
  mutate(age_enter = round(age_enter, digits = 0)) %>%
  ggplot(aes(x = reorder(name, age_enter),
             y = age_enter,
             fill = party)) +
  geom_bar(stat = "identity") +
  coord_flip() +
  scale_fill_manual(values = c( "#8e2420","#66bb66","#6699ff")) +
  theme(text = element_text(size = 40),
    axis.title.x = element_blank(),
    axis.title.y = element_blank(),
    panel.background = element_rect(fill = 'transparent'),
    plot.background = element_rect(fill = 'transparent', color = NA),
    panel.grid.major = element_blank(),
    panel.grid.minor = element_blank(),
    legend.background = element_rect(fill = 'transparent'), #transparent legend bg
    legend.key.size = unit(2, 'cm'),
    legend.key.height = unit(2, 'cm'),
    legend.key.width = unit(2, 'cm'),
    legend.title = element_blank(),
    legend.text = element_text(size = 20) )

ggsave('age_chart.png', age_chart, bg = 'transparent')
Ages of the Taoiseach entering office for the first time
Source: Wikipedia
We can calculate to see which party has held the office of Taoiseach the longest with a special, but slightly mad-looking pie chart
Click here to learn more about creating these plots.
full_taois %>%
  distinct(name, .keep_all = TRUE) %>%
  group_by(party) %>%
  summarise(total_cum = sum(cum_days)) %>%
    ggplot(aes(reorder(total_cum, party), total_cum, fill = as.factor(party))) +
  geom_bar(stat = "identity") +
  coord_polar("x", start = 0, direction = - 1)  +
  scale_fill_manual(values = c( "#8e2420","#66bb66","#6699ff")) +
  ggthemes::theme_map()
Number of years each party held the office of Taoiseach
Source: Wikipedia
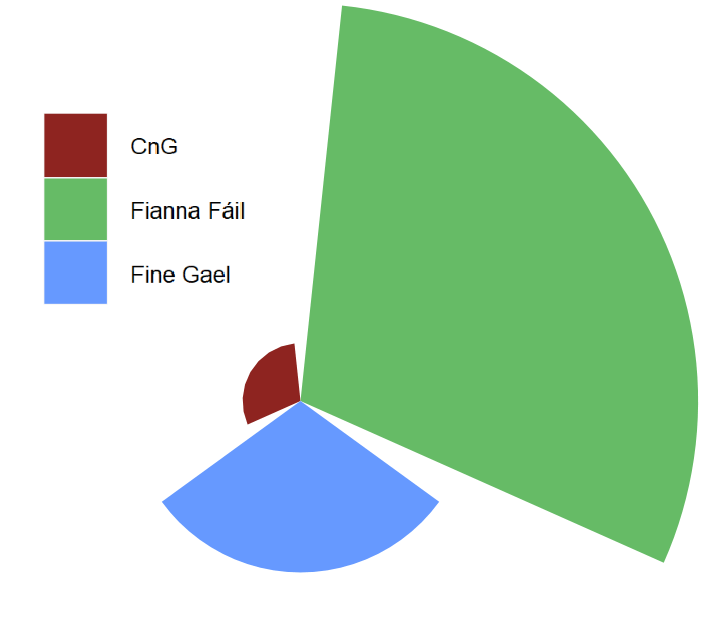
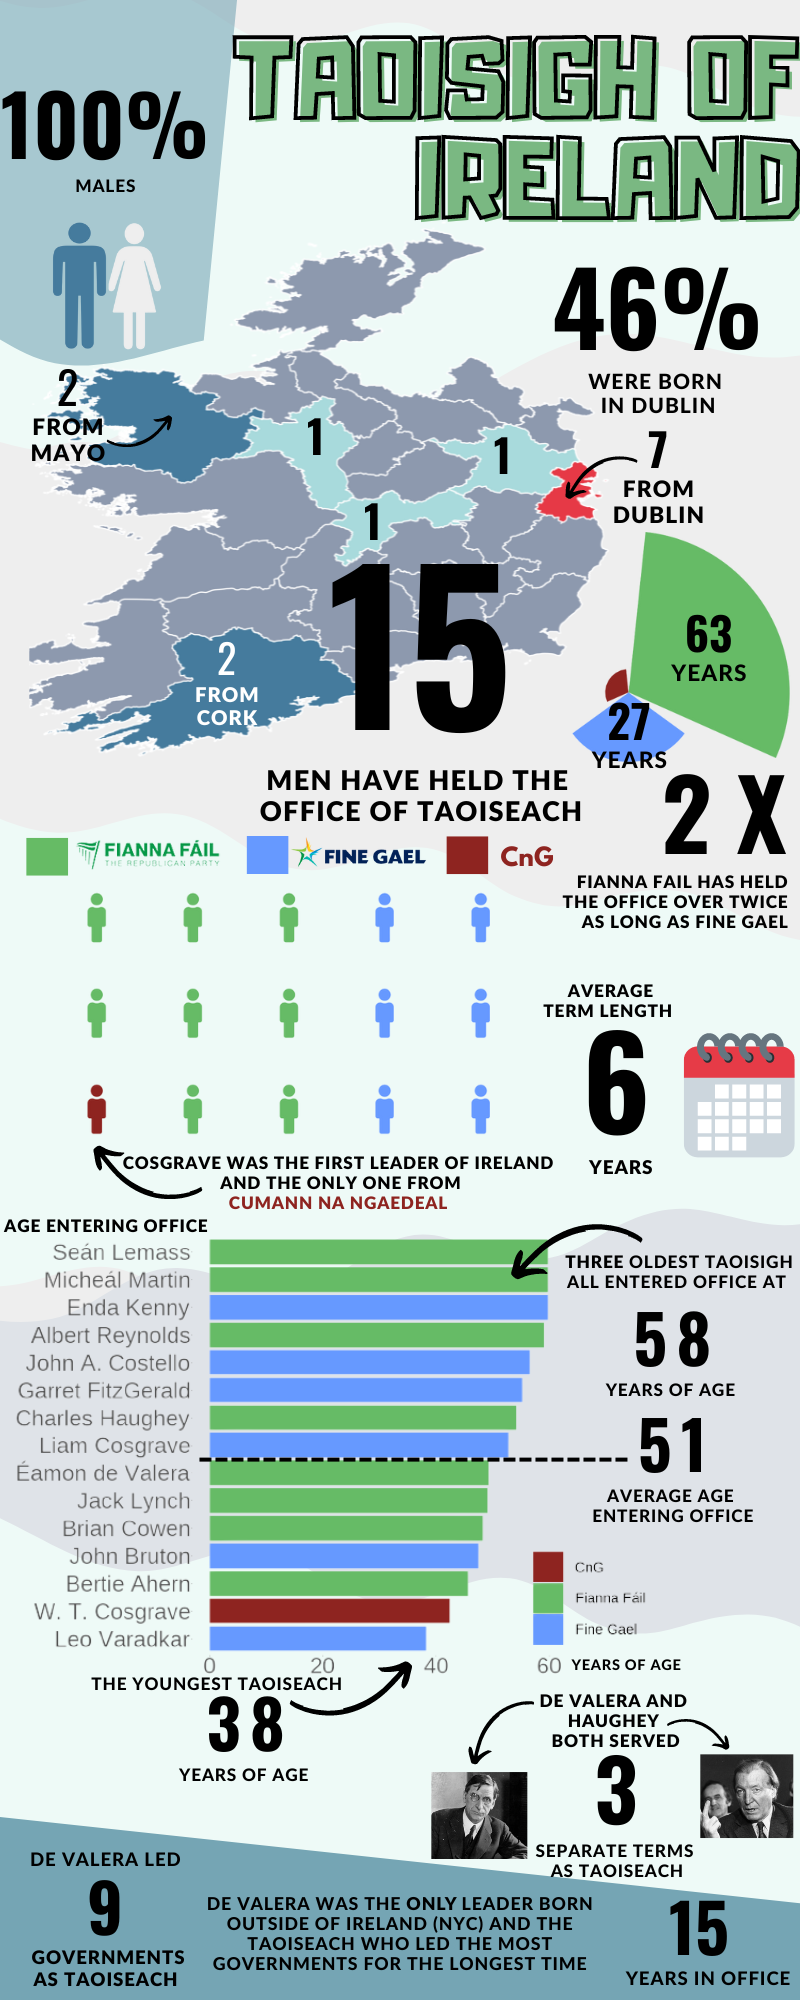
Fianna Fail has held the office over twice as long as Fine Fail and much more than the one term of W Cosgrove (the only CnG Taoiseach)
Last we can create an icon waffle plots. We can use little man icons to create a waffle plot of all the men (only men) in the office, colored by political party.
I got the code and tutorial for making these waffle plots from the following website:
https://www.listendata.com/2019/06/create-infographics-with-r.html
It was very helpful in walking step by step through how to download the FontAwesome icons into the correct font folder on the PC. I had a heap of issues with the wrong versions of the htmltools.
remotes::install_github("JohnCoene/echarts4r")

remotes::install_github("hrbrmstr/waffle")

devtools::install_github("JohnCoene/echarts4r.assets")

remotes::install_github("hrbrmstr/waffle")

library(echarts4r)
library(extrafont)
library(showtext)
library(magrittr)
library(echarts4r.assets)
library(htmltools)
library(waffle)

extrafont::font_import(path = "C:/Users/my_name/Desktop",  pattern = "fa-", prompt =  FALSE)

extrafont::loadfonts(device="win")

font_add(family = "FontAwesome5Free-Solid", regular = "C:/Users/my_name/Desktop/fa-solid-900.ttf")
font_add(family = "FontAwesome5Free-Regular", regular = "C:/Users/my_name/Desktop/fa-regular-400.ttf")
font_add(family = "FontAwesome5Brands-Regular", regular = "C:/Users/my_name/Desktop/fa-brands-400.ttf")

showtext_auto()
Next we will find out the number of Taoisigh from each party:
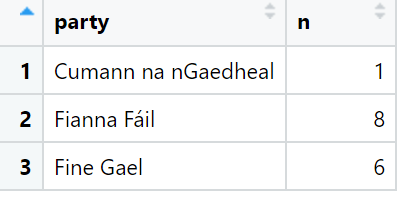
And we fill a vector of values into the waffle() function. We can play around with the number of rows. Three seems like a nice fit for the number of icons (glyphs).
Also, we choose the type of glyph image we want with the the use_glyph() argument.
The options are the glyphs that come with the Font Awesome package we downloaded with extrafonts.
waffle(
  c( Cumann na nGaedheal = 1      ` = 1,
      `Fianna Fail = 8    ` = 8,
      `Fine Gael = 6    ` = 6),
  rows = 3,
  colors = c("#8e2420", "#66bb66",  "#6699ff"),
  use_glyph = "male",
  glyph_size = 25,
  legend_pos = "bottom")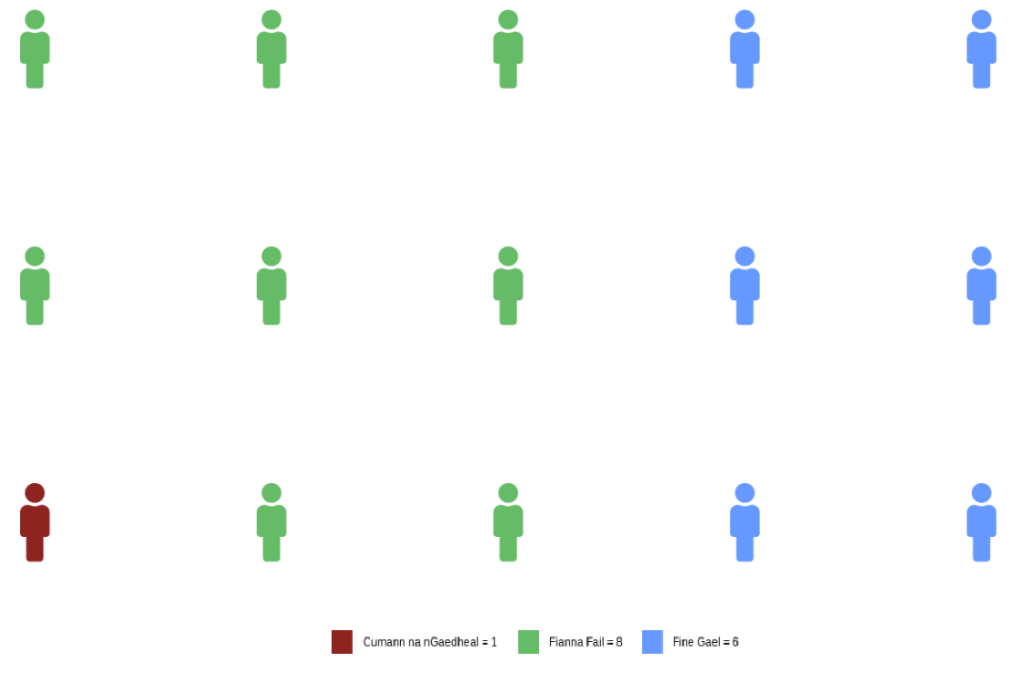
Click below to download the infographic that was edited and altered with Canva.com.


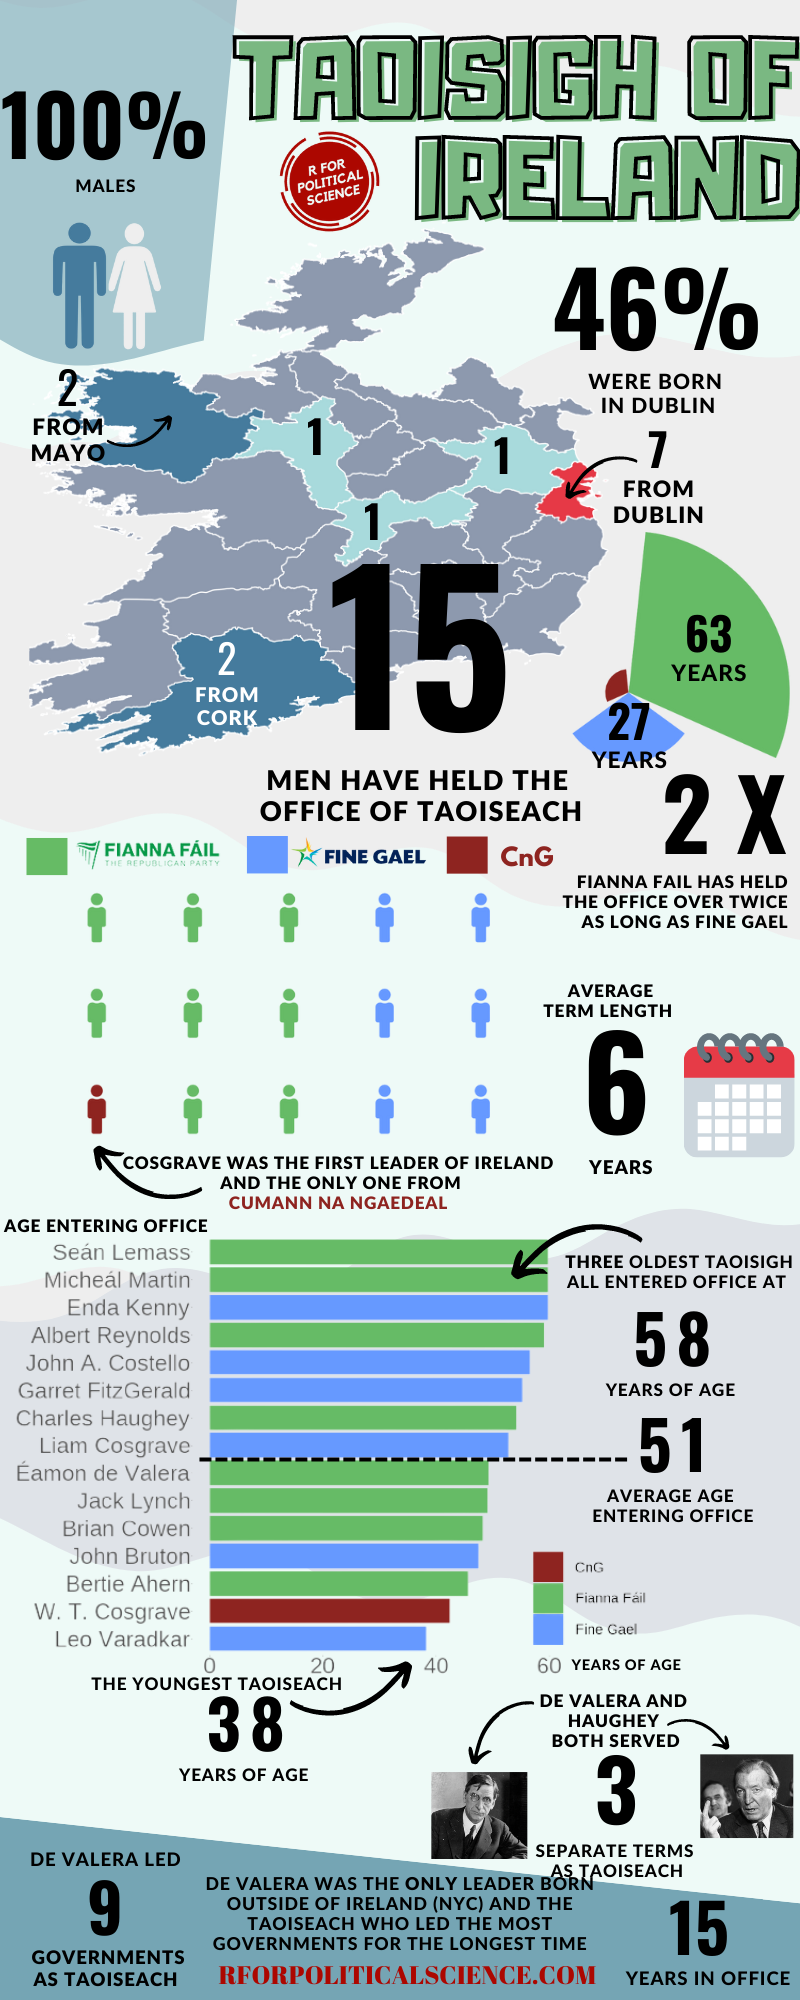